MINTbase v2.0: a database for the interactive exploration of mitochondrial and nuclear tRNA fragments (tRFs)

The Mitochondrial and Nuclear tRNA database (MINTbase) is an easy-to-use resource for accessing information on tRNA fragments (tRFs) [1,2]. MINTbase offers five vistas, that is, five different ways to view tRF fragment information. The vistas are easy-to-use, interconnected and flexible providing each user with a personalized experience.
Use of the data contained in this database is limited to research-oriented, non-profit activities only. If you are interested in for-profit use, please contact us.
Here are a few suggestions to help you personalize MINTbase. If you are wondering:
- What information exists in the database about a specific tRF? Start with "Summary vista" and select the sequence of your fragment to see its overview.
- Has anyone found this fragment expressed in their sample? Start with "expression vista" and select your fragment (click on the # of samples column) to see all samples that were submitted to MINTbase and include your tRF!
- What are the possible parental locations of a tRF? Start with "genomic loci vista" and specify parameters to see all genomic locations for your selection.
- What are the possible parental amino acids/anticodons for your tRF? Start with "RNA molecule vista" to see details.
- Where is a tRF located with respect to a parental tRNA Start with "tRNA alignment vista" and click "view alignment" to see the selected tRFs aligned under the tRNA.
Keep reading to find more information on the filters, the vistas, and more examples!
The tRNA fragments (tRFs) of the MINTbase database
MINTbase contains all possible tRNA fragments (tRFs) with lengths 16-50 nt that originate from mature tRNAs. The types of tRFs included in the database are 5'-half (or 5'-tRH), 5'-tRF, i-tRF, 3'-tRF, and 3'-half (or 3'-tRH). tRNA halves (tRHs) are the first category of tRNA-derived fragments that was reported [3,4] in the early 2000s. More recently, 5'-tRF, 3'-tRF [5], and i-tRF [6] were identified.
To list all possible tRFs, we start from the mature tRNA sequences and enumerate all possible subsequences. When we add deep sequencing data to the database, we note which tRFs were, in fact, discovered in a sample. We call those tRFs "expressed". MINTbase, by default, shows only expressed tRFs. See more on this on the RPM filter.
MINTbase contains a variety of projects, most notable of which is The Cancer Genome Atlas. MINTbase is regularly updated. The profiles of all samples presented in MINTbase were mapped uning MINTmap, our tRNA derived fragment mapping tool.
Filters
MINTbase's filters differ depending on the vista. They can be used to refine the database's tRF results. For example, you can retrieve only the 5'-tRHs of the AlaAGC or SerACT amino isodecoders. Some filters are required, namely, the genome, and the minimum RPM value, while others are optional, e.g., the tRF anticodon or the tRF sequence.
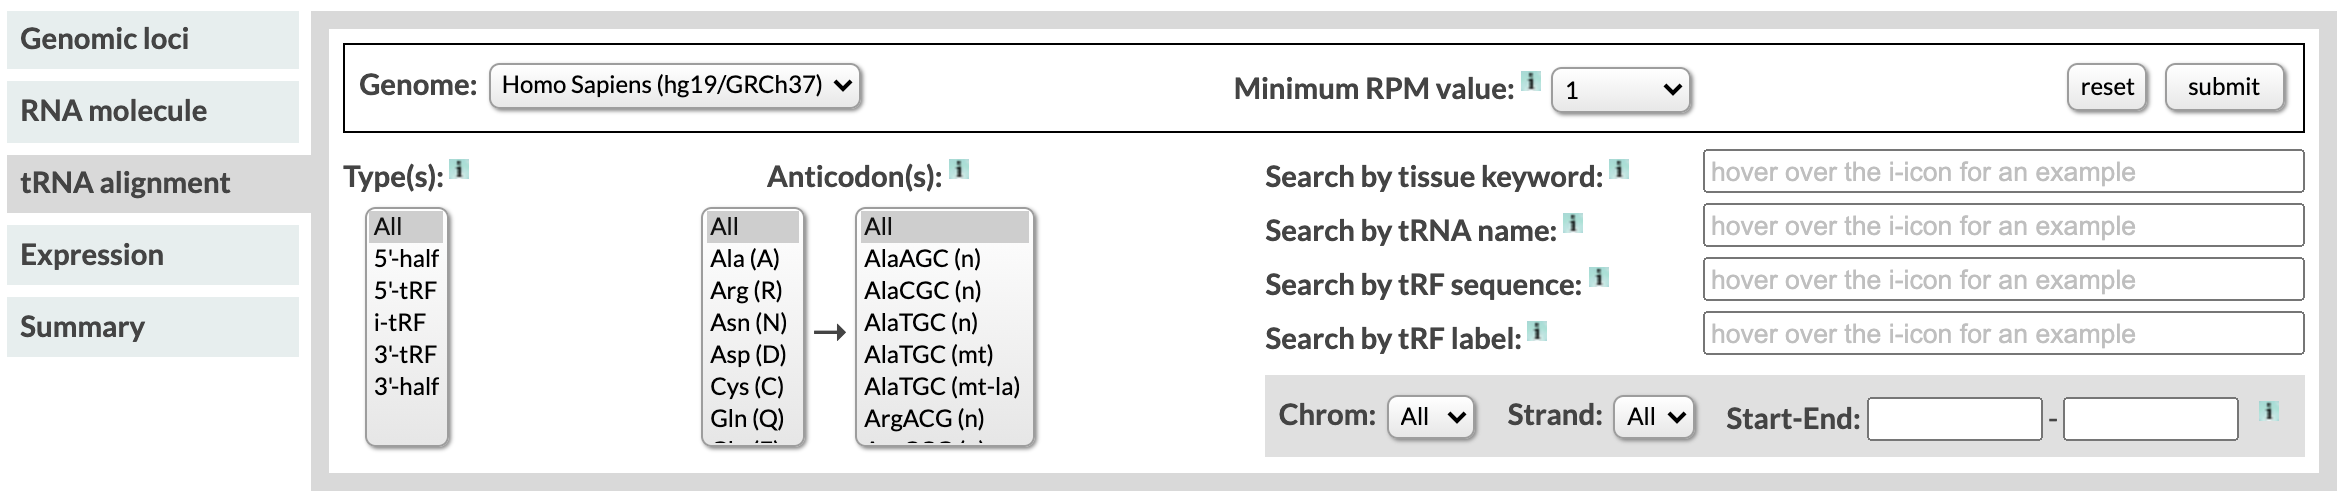
The Genome filter
MINTbase currently contains the tRFs of Homo Sapiens GRCh37. The GRCh37 tRNAs types are true tRNA, pseudo tRNA, exact tRNA-lookalikes, and MT-tRNA. We retrieved the tRNAs from gtRNAdb v1 and [7], and mapped against the genome from the UCSC genome browser. All profiles of the projects were mapped using MINTmap.
The Minimum RPM value filter
Reads per million (RPM) measures the abundance of a molecule within a sample. We calculate the RPM by dividing the times a tRF was found in a sample by the total number of sequenced reads of the sample and multiplying by a million. We say that a tRF is expressed when there exists at least one sample submitted to the database in which the tRF has RPM more than 1.
In the database, we include all tRFs that can exist, regardless of whether they are yet expressed or not. Since the tRNA sequence space of a genome is finite, there exists an upper bound to the number of distinct tRF sequences that mature tRNAs can ever produce. As the number of discovered tRFs is likely to increase, it is reasonable to expect that at least some of this currently not-expressed tRFs will be discovered by subsequent studies to be expressed in some setting. The user can select the threshold of their choice using this filter.
When the users select "all tRFs", the expressed and not expressed tRFs of the database will be displayed. Note that not expressed also includes tRFs that had RPM less than 1 in some samples. When the user selects any numerical value, only the tRFs that had an RPM equal or higher than that value in any of the samples currently submitted in MINTbase are displayed.
The Type filter
The tRF types are 5'-half (or 5'-tRH), 5'-tRF, i-tRF, 3'-tRF, and 3'-half (or 3'-tRH).
The type of a tRF depends on its endpoints. 5'-tRHs and 5'-tRFs have an endpoint in the 5' end of the mature tRNA. The difference between a 5'-tRF and a 5'-tRH is that tRNA halves have their other endpoint in the anticodon loop, unlike 5'-tRFs. Similarly, for the 3'-tRFs and 3'-tRHs. Internal tRNA fragments, or i-tRFs, are the tRNA-derived fragments for which none of these rules apply. They begin and end anywhere in the tRNA except the 5' and 3' ends. They are the most populous tRF type.
The type filter allows the user to select one or multiple tRF types. To select multiple types, hold down the shift or command key while you click on the types you need. When you select multiple types, the tRFs that belong in any of the types you selected will appear (in other words, you retrieve the union of the tRF types).
The Anticodon filter
This filter allows the user to select one or multiple amino acids and anticodons, the results of the database will include only tRFs which may originate from tRNAs of those isodecoders. To select multiple types, hold down the shift or command key while clicking on the options you need. When you select multiple options, the results are the combination of each separate selection (in other words, you will see the union of your selections).
We are following the notation (n) and (mt) to indicate nuclear and mitochondrial tRNAs. We also use (mt-la) to indicate tRNA-lookalikes.
The Tissue Keyword filter
You can use this filter to select samples of a specific tissue of disease, only tRFs that are present in those samples will be returned from the database. Some examples are TCGA-BRCA or Lung, you can also view the full list of keywords. The search can identify misspellings.
The tRNA name filter
To ensure the effort-less use of MINTbase, we accommodated multiple tRNA nomenclatures and thus allow the use of different tRNA identifiers when composing a search. The nomenclatures recognized are our own names, HGNC symbols, Legacy IDs, and gtRNAdb IDs.
The tRF sequence filter
This field accepts any nucleotide sequence. If the sequence is an expressed tRF in the selected genome, MINTbase will return the results. If it's not, suggestions will be made for similar tRFs or MINTbase will report no results. We recommend that you set RPM to "all" in case your fragment is a tRF but is not yet expressed in the database.
The tRF label filter
This field accepts License Plates and an additional nomenclature we have used on earlier papers. Similarly to the tRF sequence filter, we recommend that you set RPM to "all" in case your fragment is a tRF but is not yet expressed in the database.
The Genomic Coordinate filter
The user can select chromosome, strand, and genomic start and end. All tRFs that have at least one nucleotide in the selected range, and are expressed in the database, will be returned.
Vistas
MINTbase offers five distinct vantage points or "vistas".
The database's "Genomic Loci" vista provides access to all possible genomic origins of the sought tRFs and their characteristics with reference to the source tRNA genes. The "RNA Molecule" vista provides access to the distribution of a tRF across all tRNAs in tRNA space. The "tRNA Alignment" vista visualizes the tRF(s) in the sequence context of the parental tRNA. The "Expression" vista provides information about the different samples, tissues, diseases, etc. in which each tRF has been reported expressed, together with the corresponding Pub-Med identifier. Finally, the "tRF Summary" vista summarizes all the information in MINTbase for each tRF individually in the form of a "record".
Genomic loci vista help
This vista provides a genome-wide overview of the database's tRFs. Given the source ambiguity of some tRFs, this vista's output usually comprises multiple rows that refer to all of the genomic instances of the same tRF sequence. Each of the optional search filters, e.g., search by tRNA label, can be applied at the genome level to allow the user to further sub-select among the currently reported results. The Genomic Loci vista is meant for those users who want to explore similarities among tRFs at the genome level. The data is presented in a tabular format that contains one genomic instance per row.
Example: You can visit the genomic loci vista to view all the five possible tRNAGlyGCC parental tRNAs of the 5'-half tRF-31-P4R8YP9LON4VD.
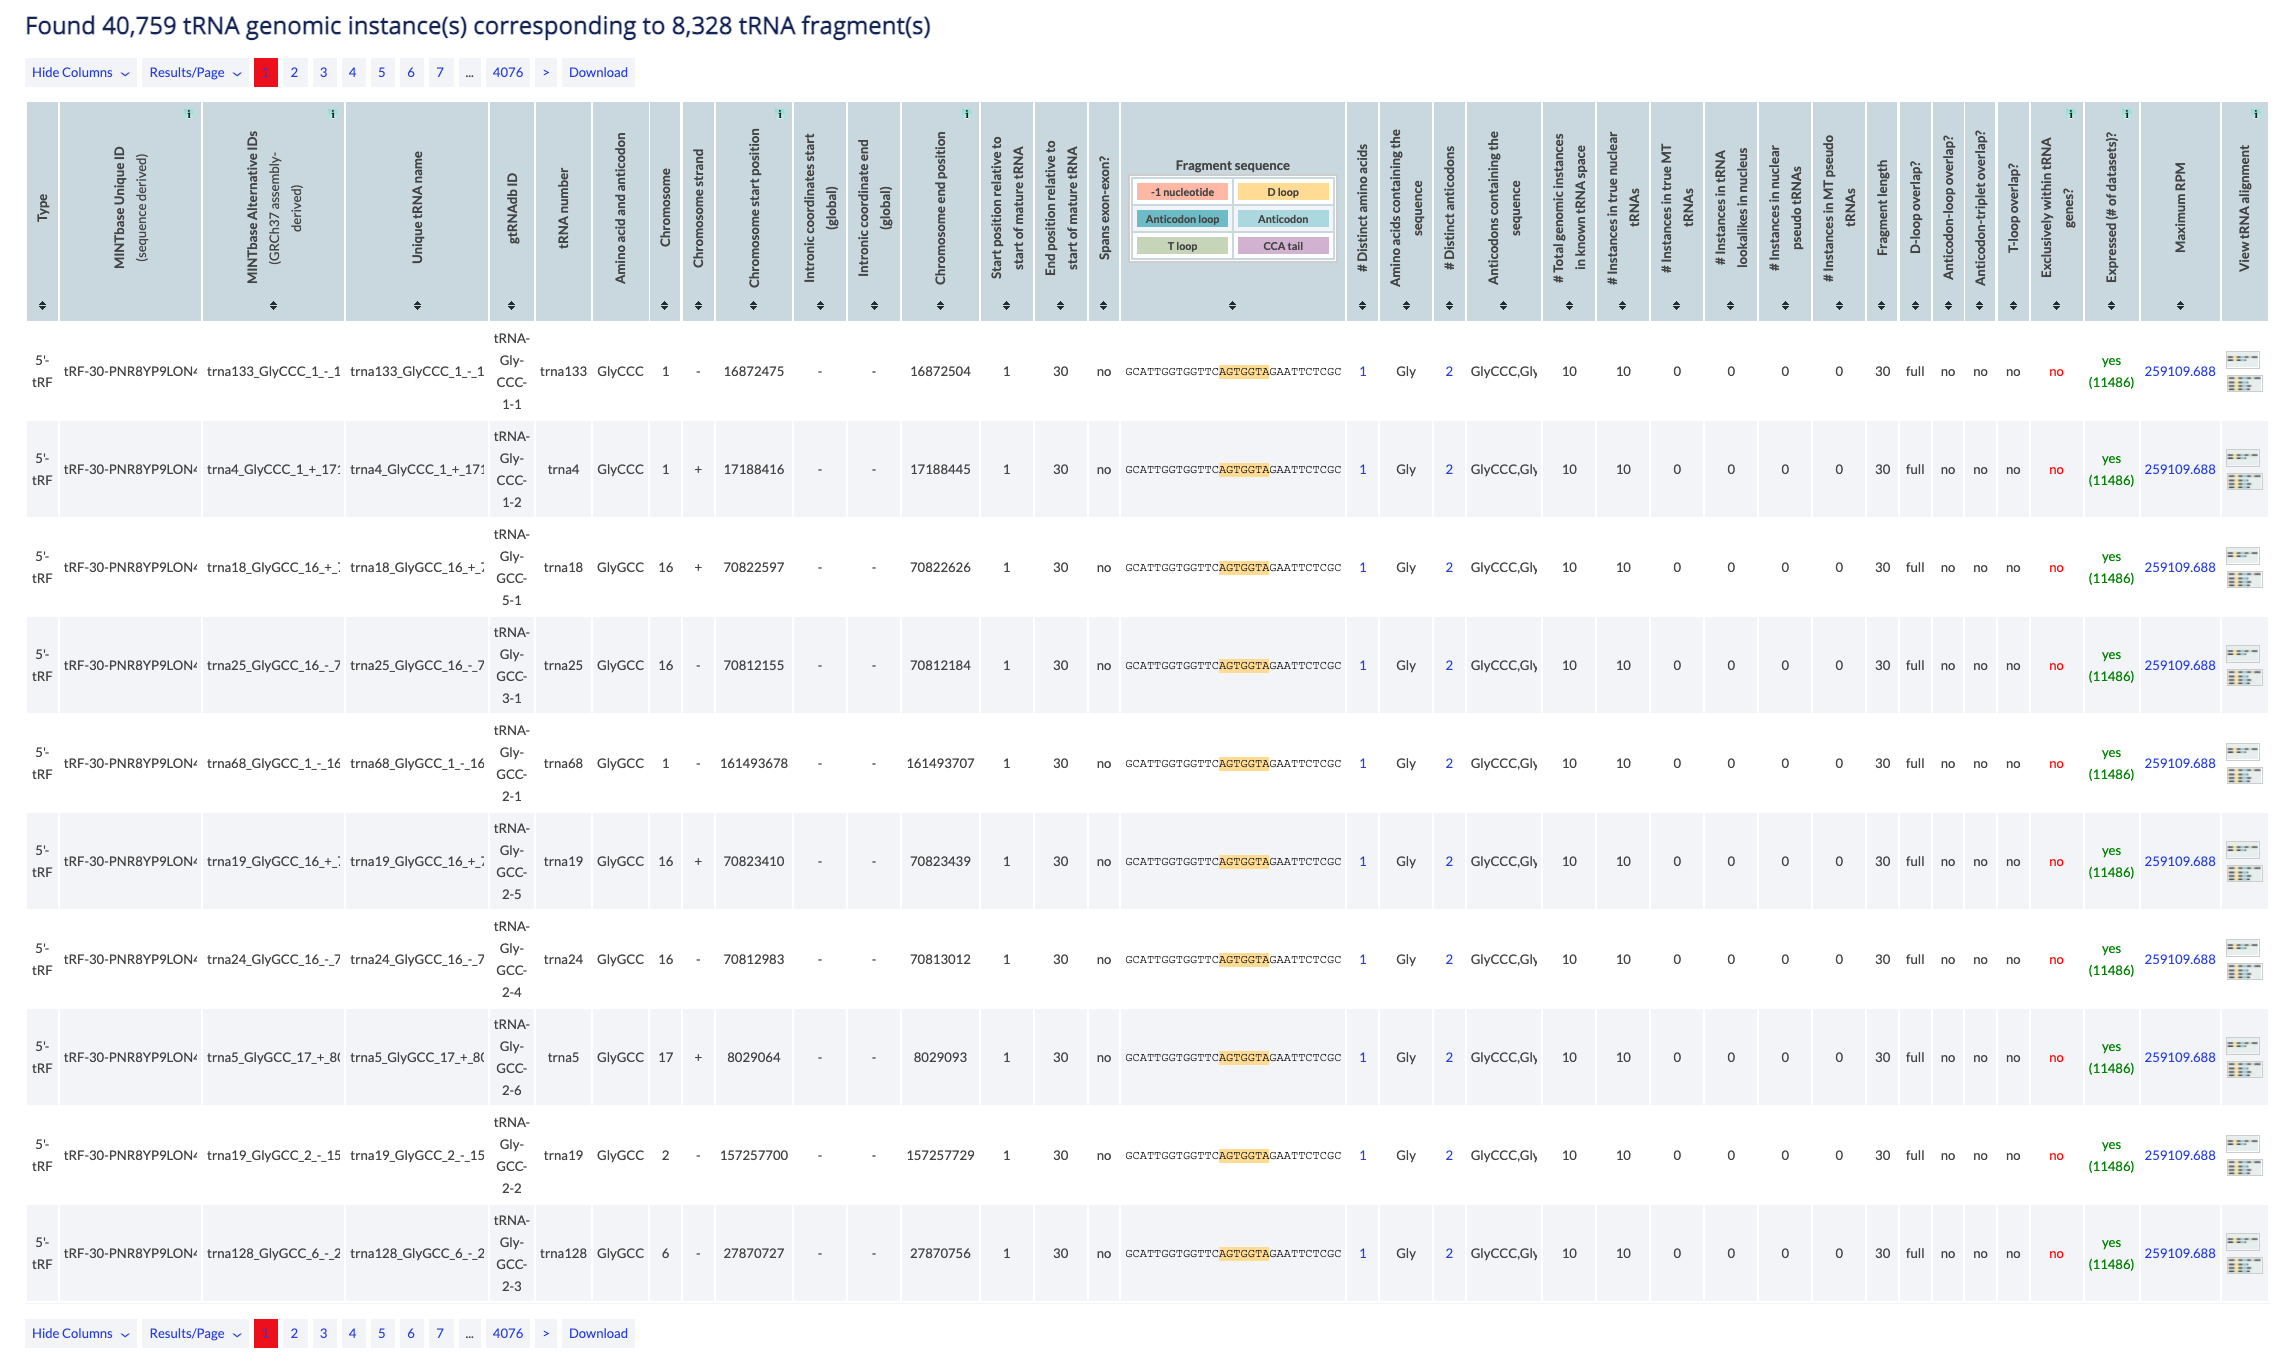
The counter at the top of the results reports the number of genomic locations that satisfy the search parameters. In this vista a tRF sequence may occupy multiple rows if it's located at multiple loci.
The table can be modifed by several buttons. You can select specific columns to view (some are always enabled, some are dy default disabled), you can change the results displayed per page (default is 10), and you can navigate to other pages. Finally, you can download to retrieve all results in simple text format. In the Genomic Loci vista, only visible columns will be returned.
The main results are presented in a table and are sortable. Click on a column header to sort it in ascending order. Hold shift and click again to sort in descending order. Hold shift and click on two or more columns to sort in any number of columns in any order you want. Hover over the [i] icon to view details about the column's contents.
The results consist of the columns described below.
- Type: The tRF type. The available types are 5'-half, 5'-tRF, i-tRF, 3'-tRF, 3'-half (see also the type filter).
- MINTbase Unique ID (sequence derived): The unique tRF name as defined by the License Plate nomenclature (see also the tRF label filter). This ID that depends solely on the tRF's genomic sequence and, hence, transcends assemblies and species.
- MINTbase Alternative IDs (GRCh37 assembly-derived): Assembly specific ID that consists of the tRNA ID (see below), the start and end position of the tRF in the mature tRNA and the tRF's length.
- Unique tRNA name: Assembly specific ID that consists of the tRNA number, the amino acid and anticodon, the chromosome, the strand, and the location on the chromosome.
- gtRNAdb ID: The gtRNAdb name of the tRNA.
- tRNA number: gtRNAdb's tRNA number of the parental tRNA. Note: this is not necessarily unique per tRNA since the numbering scheme appears chromosome centric.
- Amino acid and anticodon: Amino acid and anticodon of the parental tRNA.
- Chromosome: The chromosome of the parental tRNA.
- Chromosome strand: The strand of the parental tRNA.
- Chromosome start position: The position on the genome where the parental tRNA contains the start of the tRF. If there is also a negative number, that indicates that the tRF contains a 5' addition or the CCA tail. Which of the two, depends on the strand of the parental tRNA. The values are 1-based and all-inclusive.
- Intronic coordinates start (global): Start of the genomic location of the intron (if it exists). The values are 1-based and all-inclusive.
- Intronic coordinate end (global): End of the genomic location of the intron (if it exists). The values are 1-based and all-inclusive.
- Chromosome end position: Genomic location start. The values are 1-based and all-inclusive.
- Start position relative to start of mature tRNA: Start position of the tRF within the mature tRNA. The values are 1-based and all-inclusive.
- End position relative to start of mature tRNA: End position of the tRF within the mature tRNA. The values are 1-based and all-inclusive.
- Spans exon-exon?: Whether the tRF spans across exons.
- Fragment sequence: The tRF's nucleotide sequence. The link displays the tRF in the "Summary" vista.
- # Distinct amino acids: Number of distinct amino acids of the paternal tRNAs that generate the tRF. The link presents the tRF in the "RNA molecule" vista.
- Amino acids containing the sequence: List of unique amino acids of the paternal tRNAs that generate the tRF.
- # Distinct anticodons: Number of distinct anticodons of the paternal tRNAs that generate the tRF. The link presents the tRF in the "RNA molecule" vista.
- Anticodons containing the sequence: List of unique amino acid and anticodon pairs of the paternal tRNAs that generate the tRF.
- # Total genomic instances in known tRNA space: Number of loci in tRNA space containing the tRF sequence (see also tRNA space) in the database.
- # Instances in true nuclear tRNAs: How many times this fragment appears in a nuclear true tRNA loci (no lookalikes or pseudo).
- # Instances in true MT tRNAs: How many times this fragment appears in a MT true tRNA loci (no lookalikes or pseudo).
- # Instances in tRNA lookalikes in nucleus: How many times this fragment appears in a nuclear-located lookalike tRNA (no true or pseudo).
- # Instances in nuclear pseudo tRNAs: How many times this fragment appears in a nuclear pseudo tRNA loci (no lookalikes or true).
- # Instances in MT pseudo tRNAs: How many times this fragment appears in a MT pseudo tRNA loci (no lookalikes or true).
- Fragment length: Length of the tRF's nucleotide sequence of the tRF.
- D-loop overlap?: Whether the tRF overlaps with the D-loop. Possible values are full, partial and no.
- Anticodon-loop overlap?: Whether the tRF overlaps with the anticodon loop. Possible values are full, partial and no.
- Anticodon-triplet overlap?: Whether the tRF overlaps with the anticodon. Possible values are full, partial and no.
- T-loop overlap?: Whether the tRF overlaps with the T-loop. Possible values are full, partial and no.
- Exclusively within tRNA genes?: Available values are yes and no. It will be 'no' if the fragment sequence exists in at least 1 other location outside of tRNA-space.
- Expressed (# of datasets)?: Whether the database contains a sample where the tRF is found expressed and in which the RPM exceeds or equals the set RPM value followed by the number of those samples in parentheses. If a tissue keyword is selected, the column involves only samples related to the keyword. The link presents the samples in the "expression vista".
- Maximum RPM: Maximum number of the RPM value that the tRF has in the samples curently submitted in the database. If a tissue keyword is selected, the column involves only samples related to the keyword. The link presents the samples in the "expression vista".
- View tRNA alignment: The first image is a link to the alignment of the tRF on the parental tRNA. The second image is a link to the alignment of all tRFs of the parental tRNA contained in the table.
RNA molecule vista help
This vista is molecule-centric and presents a summary of the fragment's basic characteristics. The RNA Molecule vista is meant for those users who want to obtain basic level information of the tRF of interest and its potential origins in a summarized format. The data is presented in a tabular format in this vista, with each row containing a unique tRF sequence.
Example: You can visit the RNA molecule vista to view the 5'-tRF tRF-23-RK9P4P9LDS which contains the D-loop, has 13 potential parental tRNAs of 5 distinct anticodons.
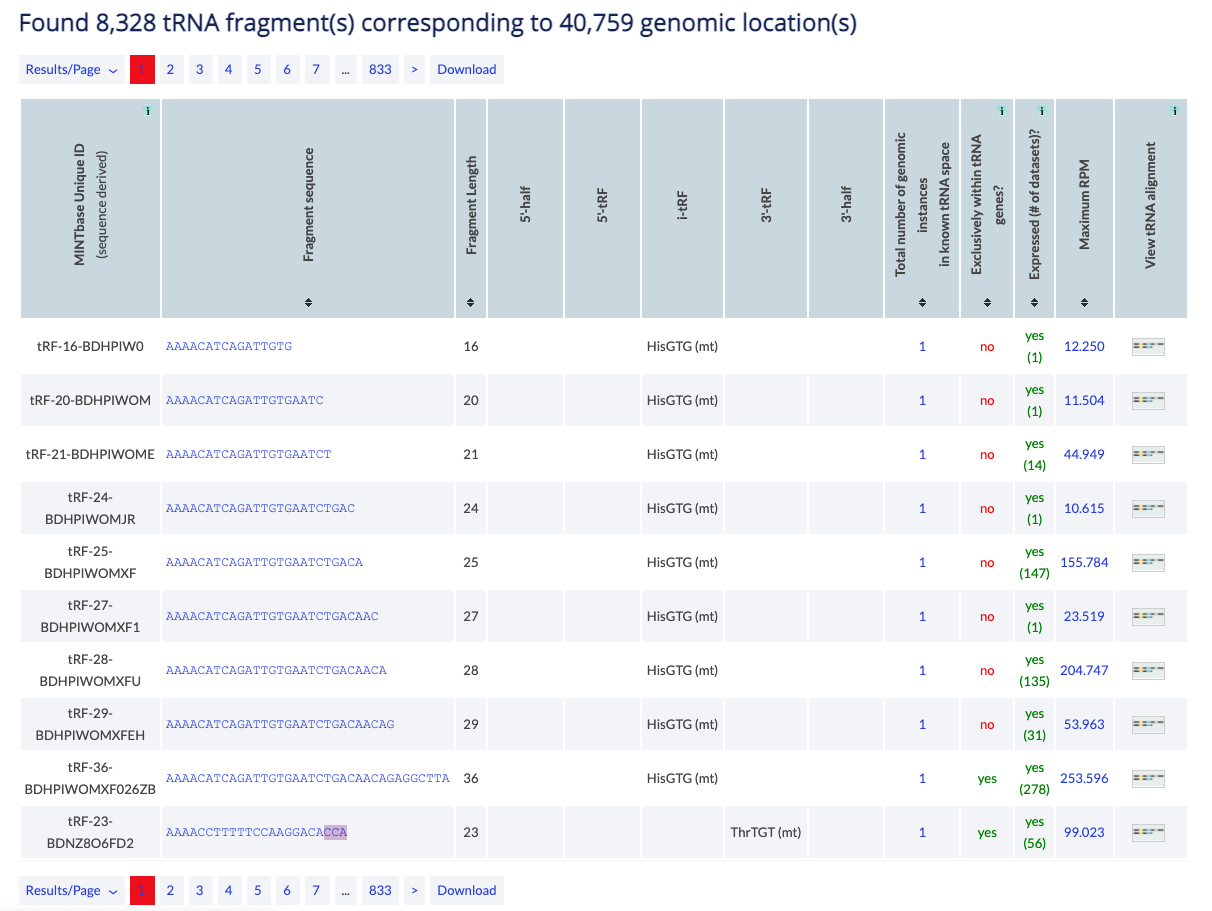
The counter shows the number of distinct tRFs that have at least one parental tRNA that fits the selection of filters. Information from all potentail parental loci is used to complete the table.
The table can be modifed by several buttons. You can change the results displayed per page (default is 10) and you can navigate to other pages. Finally, you can download to retrieve all results in simple text format.
The main results are presented in a table and are sortable. Click on a column header to sort it in ascending order. Hold shift and click again to sort in descending order. Hold shift and click on two or more columns to sort in any number of columns in any order you want. Hover over the [i] icon to view details about the column's contents.
The results consist of the columns described below.
- MINTbase Unique ID (sequence derived): The unique tRF name as defined by the License Plate nomenclature (see also the tRF label filter). This ID that depends solely on the tRF's genomic sequence and, hence, transcends assemblies and species.
- Fragment sequence: The tRF's nucleotide sequence. The link displays the tRF in the "Summary" vista.
- 5'-half, 5'-tRF, i-tRF, 3'-tRF, 3'-half: Using information from the tRF's parental tRNAs, this is a list of amino acids and anticodons in which the tRF belongs to the type shown in the column (see also the type filter).
- Total number of genomic instances in known tRNA space: Number of distinct loci in tRNA-space containing the tRF. The link leads to the genomic loci vista for the corresponding tRF (see also tRNA space).
- Exclusively within tRNA genes?: Available values are yes and no. It will be 'no' if the fragment sequence exists in at least 1 other location outside of tRNA-space.
- Expressed (# of datasets)?: Whether MINTbase contains a sample where the tRF is found expressed and the number of samples in which the RPM exceeds the filter value. If a tissue keyword is selected, the column involves only samples related to the keyword. The link presents the samples in the "expression vista".
- Maximum RPM: Maximum "reads per million" that the tRF has in one of the MINTbase samples. If a tissue keyword is selected, the column involves only samples related to the keyword. The link presents the samples in the "expression vista".
- View tRNA alignment: The image is a link to the alignment of the tRF on the parental tRNA. If there are more than one candidate parental tRNAs, you will have to select which to view.
tRNA alignment vista help
This vista is mature-tRNA-centric and presents the possible alignments between tRFs and the parental tRNA gene. The tRNA Alignment vista is meant for users who want to explore the tRF-generation potential of a tRNA across each of the five structural types or wish to visualize the tRF(s) of their choice. If more than one tRNA is selected, the user must select one before proceeding to the alignment.
If a tRNA is not selected, then MINTbase presents all tRNAs that fit the filters selected. The user has to click on the image on the last column to proceed to the alignment.
Example: You can use the tRNA alignment vista to view the alignments of tRFs on AlaAGC tRNAs.
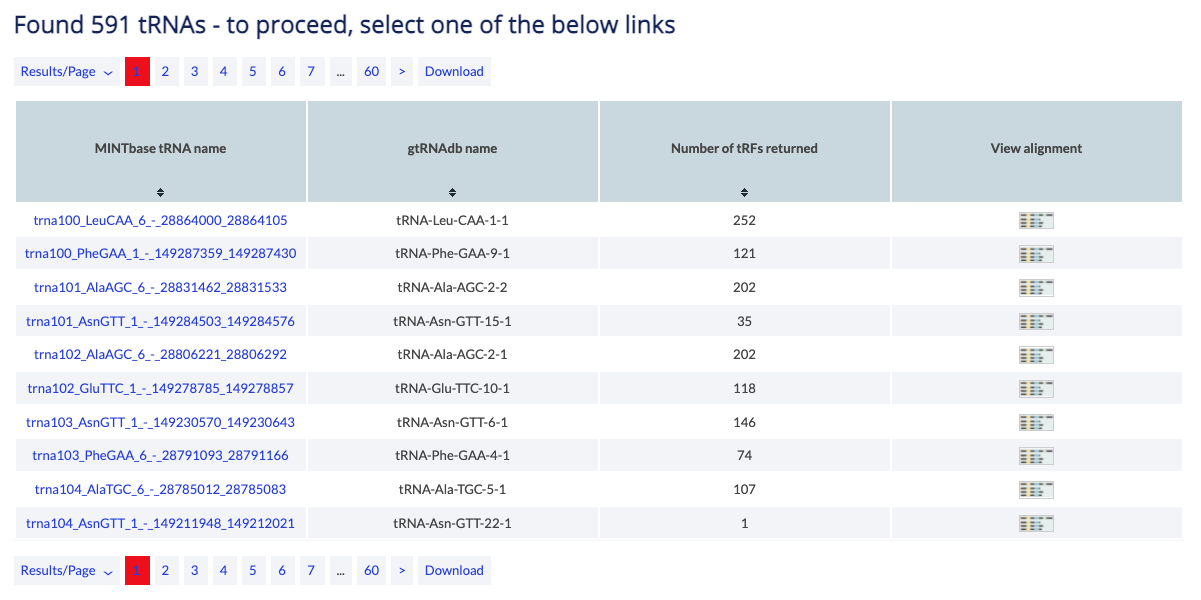
The counter shows the number of tRNAs that fit your parameters. You have to select one to continue to the alignment.
The table can be modifed by several buttons. You can change the results displayed per page (default is 10) and you can navigate to other pages. Finally, you can download to retrieve all results in simple text format.
The main results are presented in a table and are sortable. Click on a column header to sort it in ascending order. Hold shift and click again to sort in descending order. Hold shift and click on two or more columns to sort in any number of columns in any order you want. Hover over the [i] icon to view details about the column's contents.
The results consist of the columns described below.
- MINTbase tRNA name: MINTbase assembly derived tRNA ID. View correspondence table. The link leads to the summary vista's tRNA page.
- gtRNAdb name: The gtRNAdb name.
- Number of tRFs returned: The number of fragments that have been selected by the filters and could originate from this tRNA. The tRNA alignment vista will visualize all of them.
- View alignmentClick on this column to visualize the tRFs on this tRNA.
Once a tRNA is selected, the user can see the alignment of that tRNA and all tRFs that have been selected by the filters of the database.
Example: Continuing the above example, if you select tRNA166-AlaAGC, you can view the alignment.
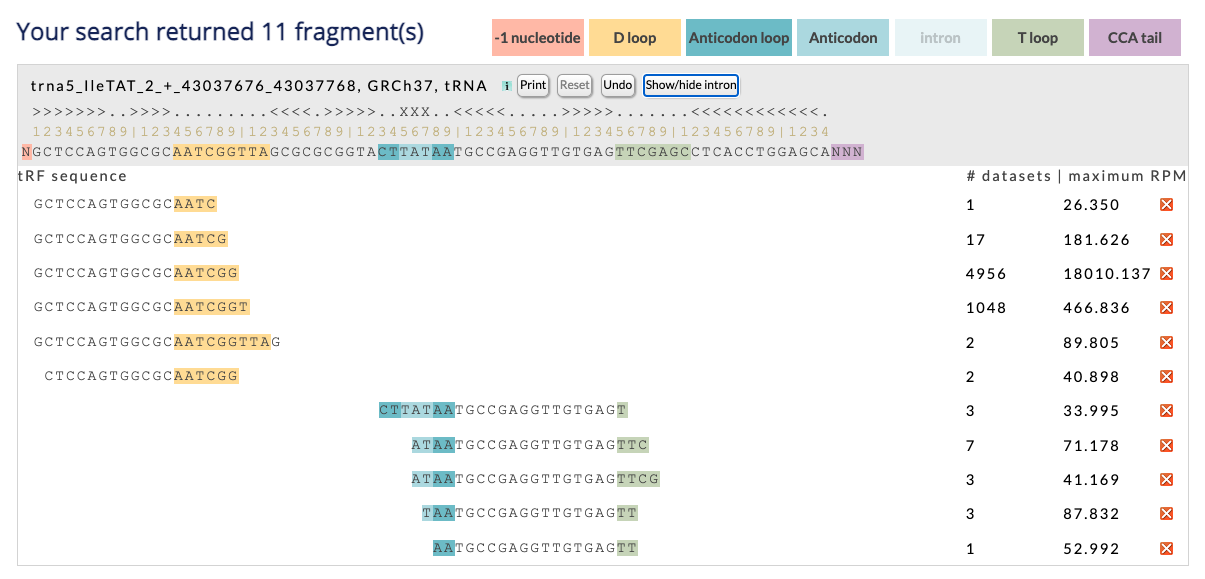
The counter shows the number of tRF that satisfy the search parameters and can originate from the specific tRNA. Beside the counter, you can see the color-legend used in the page.
The tRNA information title includes tRNA name, assembly and tRNA type. The link leads to the genomic location within the UCSC genomic browser.
The tRNA alignment vista has three buttons, the first "Print", is independent and by clicking it, you can print the page or save it to a pdf. Make sure that "print background colors" or a similar button is clicked when you open the print form. The other two buttons, "Reset" and "Undo", work together with the red X buttons located on the right of each tRF. You can click the X button on the right of a tRF, to remove the tRF from the page. You can undo the last action by clicking "undo", undo multiple actions by clicking it repeatedly, or reset the page to its initial state by clicking "reset". When you click "reset" the intron (if exists) will also return to its default visualization. You can use the "X" buttons to choose the tRFs you want in the visualization before you print.
When the tRNA contains an intron, you can click the "Show/Hide intron" button to show or hide the intron from both the tRNA and the tRF areas.
The rest of the tRNA header contains the tRNA secondary structure, a ruler, and the tRNA sequence. The structure of tRNAs is obtained by gtRNAdb and for tRNA lookalikes, we use the same secondary structure as for the source tRNA structure. The numbered ruler provide an easy way to find the location of the tRF in the spliced or unspliced tRNA (depended on whether the intron is hidden or not). The vertical bar symbol "|" indicates a mutliple of ten (first is ten, second is twenty etc). Finally, the tRNA header is stationary and you can scroll up and down the tRFs.
Under the tRNA header is the scrollable tRF area. The tRF's position is aligned with the tRNA, and the structures are also indicated by using color labels. The tRF sequence is a link to the summary vista. Alongside the sequence, two numbers are displayed, and the button removes the tRF from the display. The first number shows how many samples are currently submitted to MINTbase and contain the tRF and satisfy all other selected criteria (e.g., samples with RPM over 5 or breast tissue samples). The second number shows the maximum RPM of the tRF in those samples. Both numbers are links to Expression vista. There you can see specific information about these samples.
Expression vista help
This vista presents information about the samples that include a specific tRF. If the search parameters retrieved multiple tRFs from the database, then the user will select their sequence of interest by clicking on the number of samples or the maximum RPM value.
If a tRF is not selected, MINTbase will prompt you to select one before you can proceed to view the samples.
Example: You can use the tRNA Expression vista to view the samples in which the 5'-halves of tRNATyrGTA are expressed.
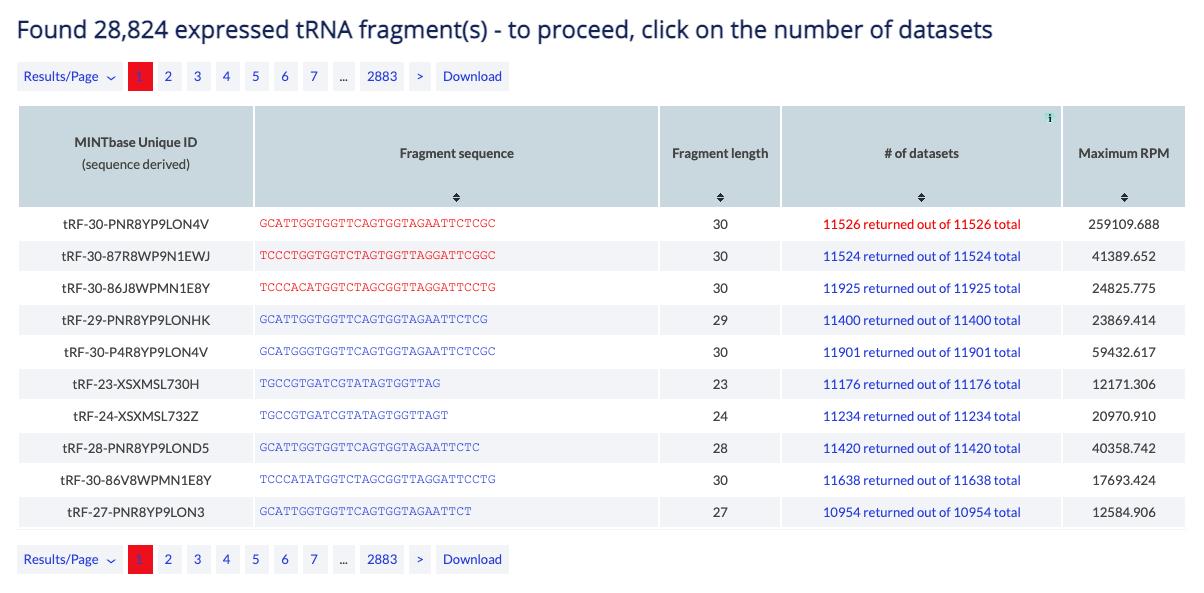
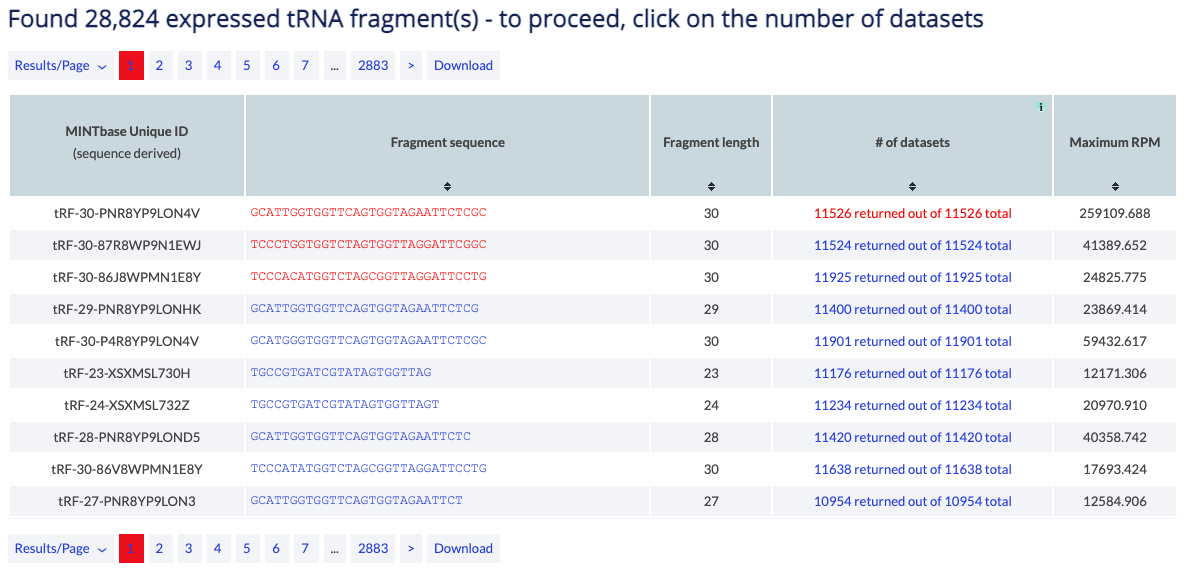
The counter at the top of the results reports the number of tRFs that satisfy the search parameters. When a user selects a tRF they can click on the column "# of datasets" to proceed to the list of samples in which the tRF is present.
The table can be modifed by several buttons. You can change the results displayed per page (default is 10), and you can navigate to other pages. Finally, you can download to retrieve all results in simple text format.
The main results are presented in a table and are sortable. Click on a column header to sort it in ascending order. Hold shift and click again to sort in descending order. Hold shift and click on two or more columns to sort in any number of columns in any order you want. Hover over the [i] icon to view details about the column's contents.
The results consist of the columns described below.
- MINTbase Unique ID (sequence derived): The unique tRF name as defined by the License Plate nomenclature (see also the tRF label filter). This ID that depends solely on the tRF's genomic sequence and, hence, transcends assemblies and species.
- Fragment sequence: The tRF's nucleotide sequence. The link displays the tRF in the "Summary" vista.
- # of datasets: The number of samples currently in the database in which the tRF is found and satisfy the filters (e.g. minimum RPM and tissue). The link displays all samples in the "expression vista".
- Maximum RPM: The maximum "reads per million" of the tRF between the samples that satisfy the filters.
When one tRF is selected, one row will be shown for each deep-sequencing sample that is included in MINTbase and contains the tRF.
Example: Continuing the above example, you can view the samples in which the 5'-half tRF-30-ROD8N0X0JYOY is expressed. Also see the full list of the samples currently in MINTbase.
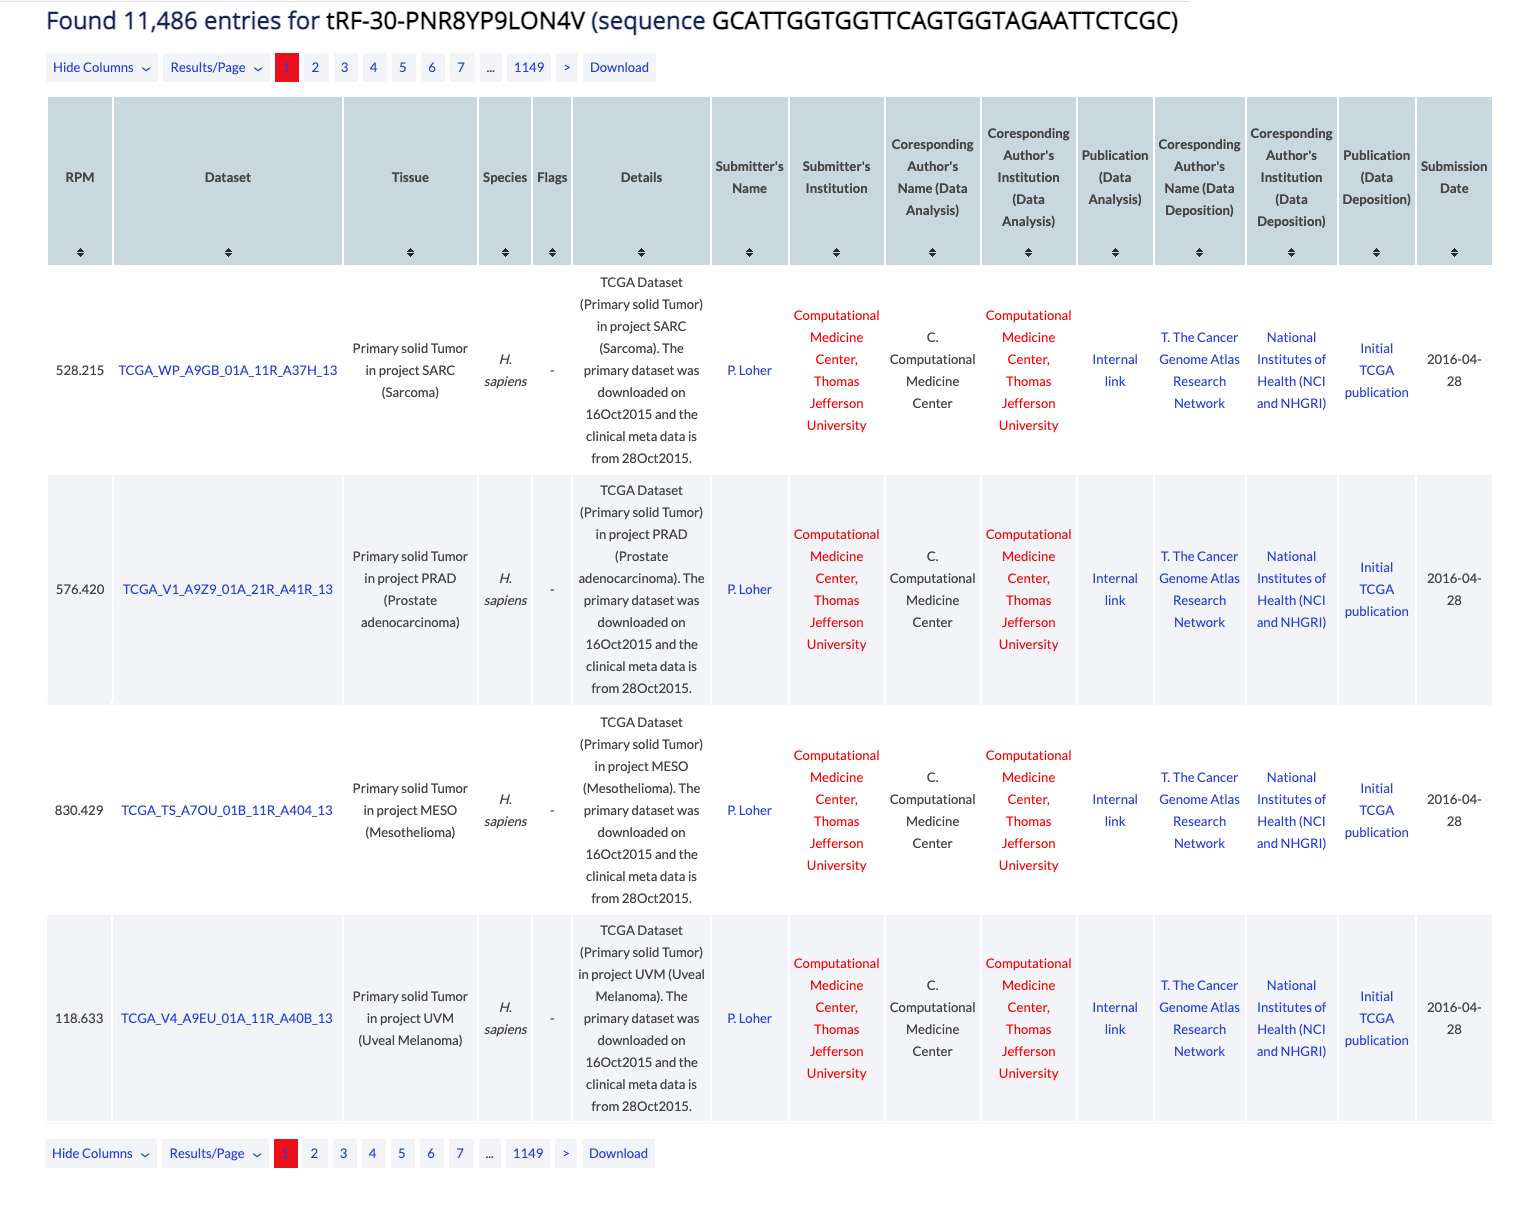
The counter at the top of the results reports the number of samples that are currently in the database, contain the tRF and satisfy the search parameters. When a user clicks on the tRF name or sequence on the title, they can open the Summary vista for the tRF.
The table can be modifed by several buttons. You can select specific columns to view (some are always enabled, some are dy default disabled), you can change the results displayed per page (default is 10), and you can navigate to other pages. Finally, you can download to retrieve all results in simple text format. In the Expression vista, only visible columns will be returned.
The main results are presented in a table and are sortable. Click on a column header to sort it in ascending order. Hold shift and click again to sort in descending order. Hold shift and click on two or more columns to sort in any number of columns in any order you want. Hover over the [i] icon to view details about the column's contents.
The results consist of the columns described below.
- RPM: Results per million. This dataset specific value corresponds to the number of reads for the tRF divided by the number of total primary data reads and is then multiplied by a million. Slight inaccuracies should be expected if the study provided used a cut-off threshold when this was calculated. MINTbase also applies a >= 1 requirement on the calculated values.
- Dataset: GEO, SRA or other ID and link to official external database.
- Tissue: Tissue studied, e.g. "Liver, HCV nonmalignant".
- Species: Species studied, e.g. "H. Sapiens".
- Flags: Flags applied to the tRFs of the dataset, e.g. 3'-cyclic Phosphate (3'-cP).
- Details: Details of both the dataset and the tRF analysis.
- Submitter's Name: Name and link to personal page of person submitting the data.
- Submitter's Institution: Affiliation and link to institution's page of person submitting the data.
- Corresponding Author's Name (Data Analysis): Name and link to personal page of corresponding author of the publication that is responsible for analyzing the data and discovering the tRFs.
- Corresponding Author's Institution (Data Analysis): Affiliation and link to institution's page of corresponding author of the publication that is responsible for analyzing the data and discovering the tRFs.
- Publication (Data Analysis): PUBMED ID or other identifier and link to the publication that is responsible for analyzing the data and discovering the tRFs.
- Corresponding Author's Name (Data Deposition): Name and link to personal page of corresponding author of the publication that is responsible for depositing the data.
- Corresponding Author's Institution (Data Deposition): Affiliation and link to institution's page of corresponding author of the publication that is responsible for depositing the data.
- Publication (Data Deposition): PUBMED ID or other identifier and link to the publication that is responsible for depositing the data.
- Submission Date: Date on which data was submitted.
Summary vista help
This vista summarizes information about a tRF. This serves not only as a reference for each molecule but also as a starting point for exploring the genomic and molecular characteristics of a tRF (e.g., its type(s), the potential tRNA gene sources, the number of instances in tRNA space, etc.) across the available vistas. The vista offers several graphs of the RPM and the number of samples that contain the sample.
If a tRF is not selected, the summary vista prompts the user to select one. The table shown is identical to the table shown in the Expression vista when a tRF is not selected. To proceed to the Summary vista for the tRF, please click on the tRF sequence. To view details about the columns of this table please visit the Expression vista section above.
When one tRF is selected, MINTbase Summary vista presents all known information about the tRF.
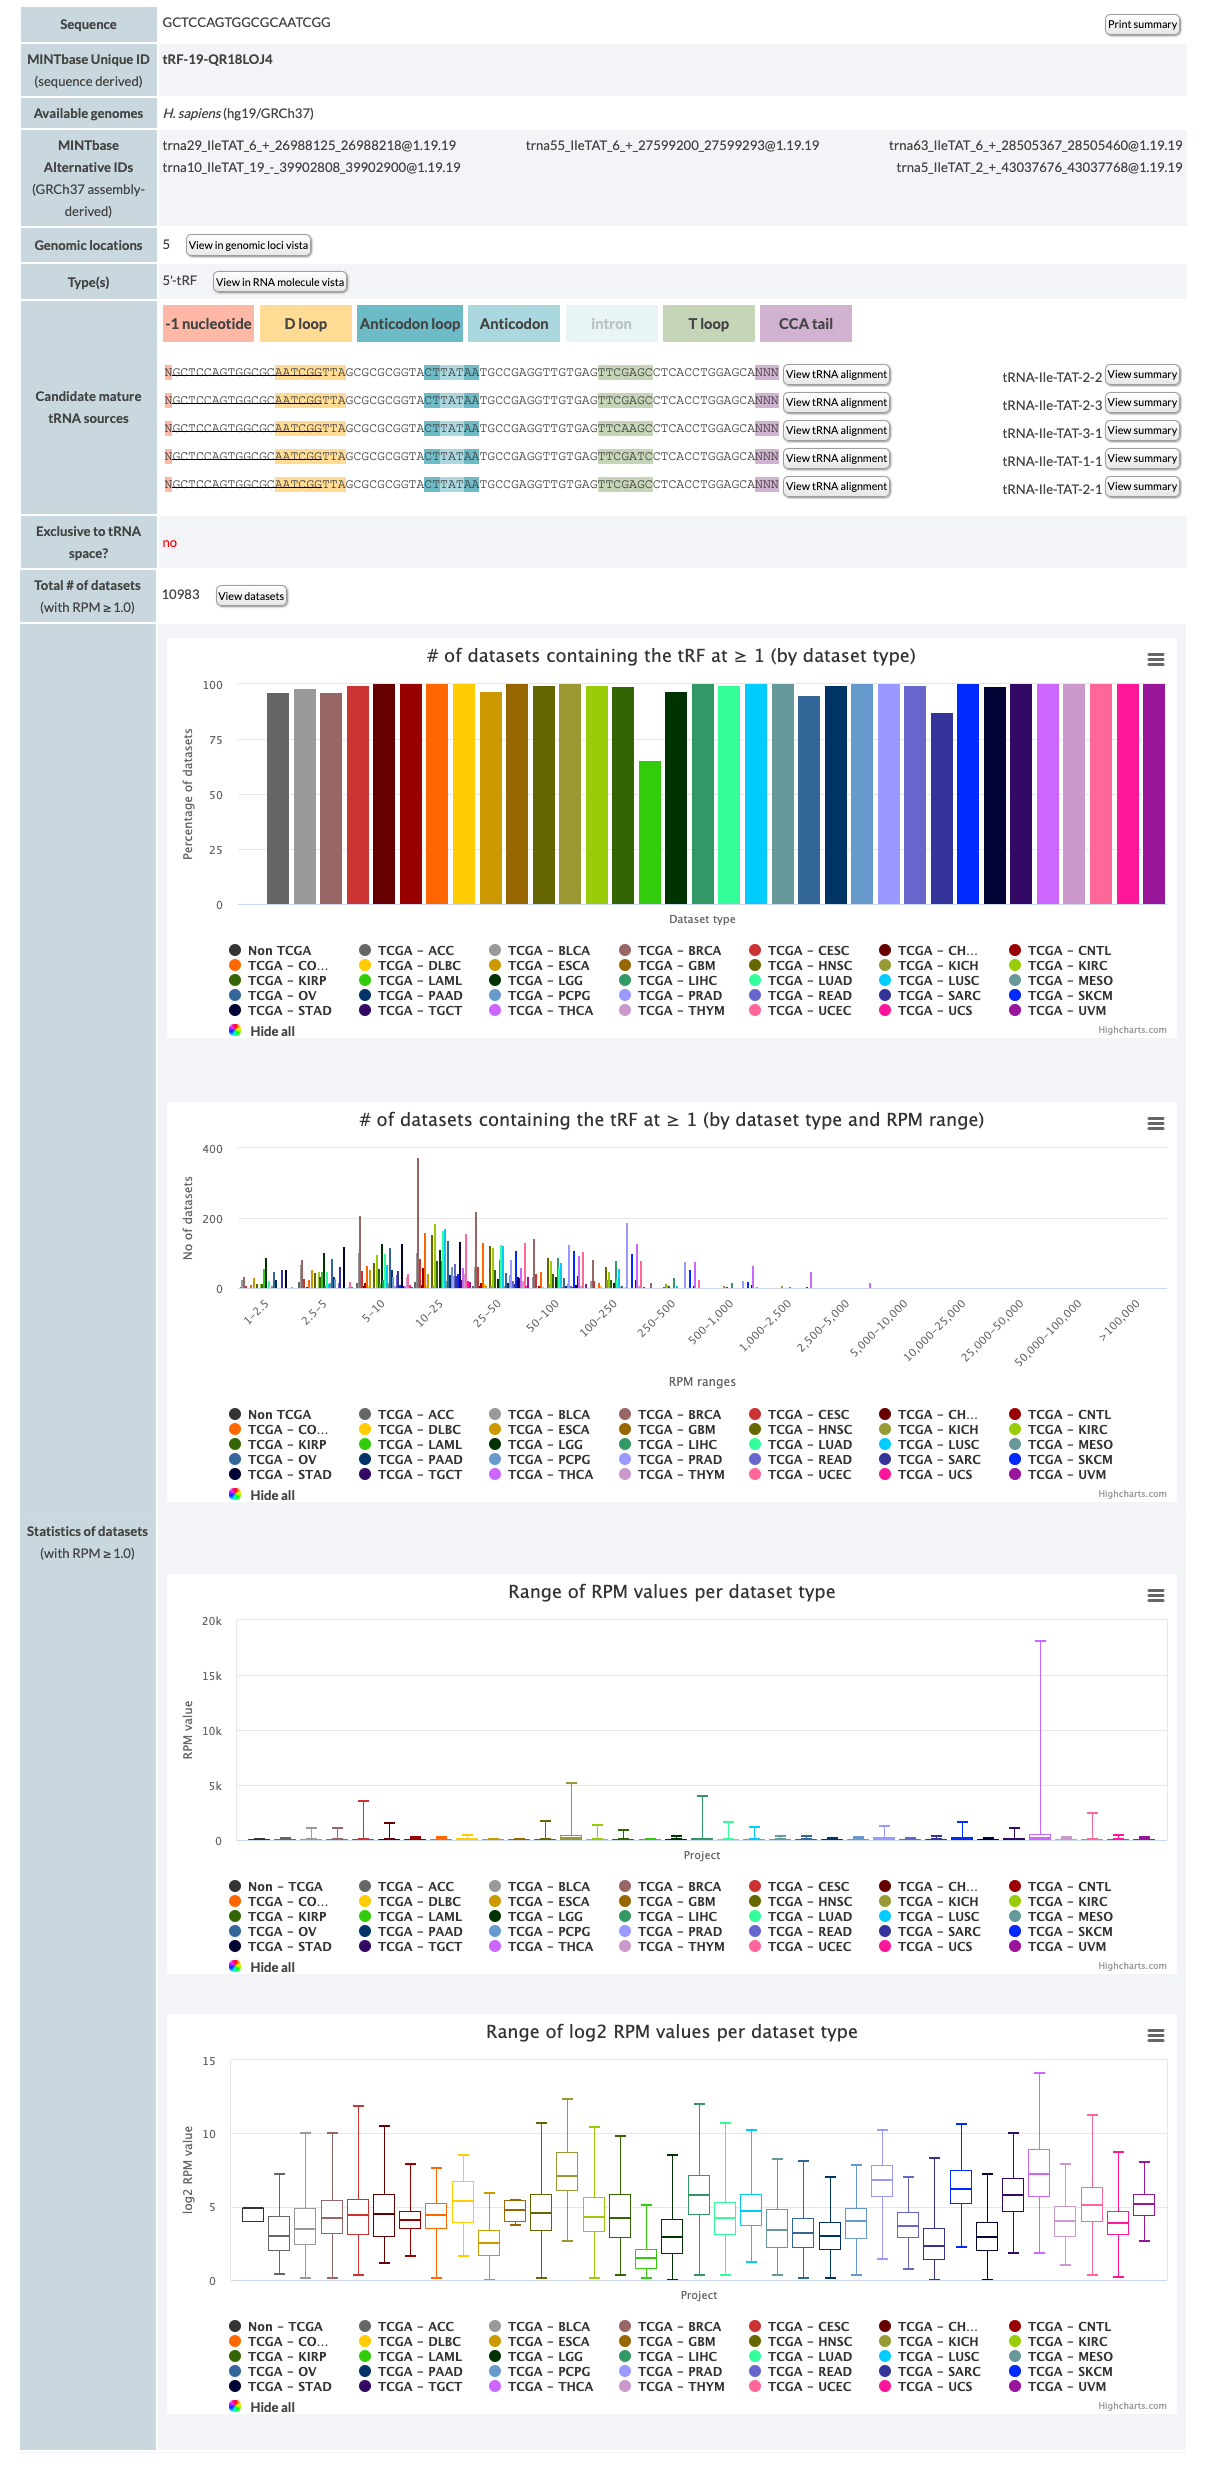
Example: You can view the Summary of the 5'-tRF tRF-19-PS5P4PJ4.
The results consist of the entities described below.
- Sequence: The tRF's nucleic acid sequence. You can click the "Print" button, to print the page or save it to a pdf. Make sure that "print background colors" or a similar button is clicked when you open the print form.
- MINTbase Unique ID (sequence derived): The unique tRF name as defined by the License Plate nomenclature (see also the tRF label filter). This ID that depends solely on the tRF's genomic sequence and, hence, transcends assemblies and species.
- Available genomes: Genomes that are included in MINTbase and contain the tRF.
- MINTbase Alternative IDs(GRCh37 assembly-derived): Assembly specific ID that consists of the tRNA ID (see below), the start and end position of the tRF in the mature tRNA and the tRF's length.
- Genomic locations: Number of distinct loci in tRNA-space containing the tRF. The link leads to the genomic loci vista for the corresponding tRF (see also tRNA space). The button links to the "genomic loci" vista for the tRF.
- Type(s): Unique type(s) for the tRF. The button links to the "RNA molecule" vista for the tRF.
- Candidate mature tRNA sources: List of the potential parental tRNAs (the gtRNAdb name is used). The tRF is underlined under each tRNA to indicate the alignment. The button links to the "tRNA alignment" vista.
- Exclusive to tRNA space? Whether the tRF's sequence can be found only on genomic locations inside the tRNA space. Available values are yes and no. Yes, indicates that the tRNA exists only in tRNA space and no, the opposite (see also tRNA space).
- Total # of datasets (with RPM ≥ 1.0): Total number of samples that are currently in the database and in which the tRF is present with RPM ≥ 1.0 (see also RPM). Click on the button to view the datasets in "Expression" vista.
MINTbase also contains a variety of graphs. The graphs are created using the Highcharts and are interactive. The three bars on the right top of each bar, allow you to view in full screen, print and download the graph in various formats including svg (which you can edit). Additionally, if you hover over the graph area you can view details about the data drawn. Clicking on the legend shows/hides the projects.
The first bar graph shows the percentage of samples per project that contain the tRF with RPM ≥ 1.0. 100% in TCGA-BRCA means that all TCGA-BRCA samples in MINTbase contain this tRF. The "Non-TCGA" column contains all samples that are in MINTbase and are not from TCGA.
The second bar graph shows the number of samples per project that contain the tRF within a specified RPM interval. E.g., In the example provided at the beginning of this section, TCGA-LIHC is 44 in the 50-100 interval; that means that 44 samples of LIHC in TCGA contain the tRF with RPM more or equal to 50 and less than 100.
The first boxplot shows the RPM values per project. Hovering over each boxplot, you can see the quartile values and the number of samples. The second boxplot shows the log2 RPM values per project.
Finally, if the user selects a tRNA instead of a tRF, they can see the information MINTbase contains about that tRNA and how the tRNAs pile up on the tRNA.
Example: You can view the Summary of a tRNA in MINTbase.
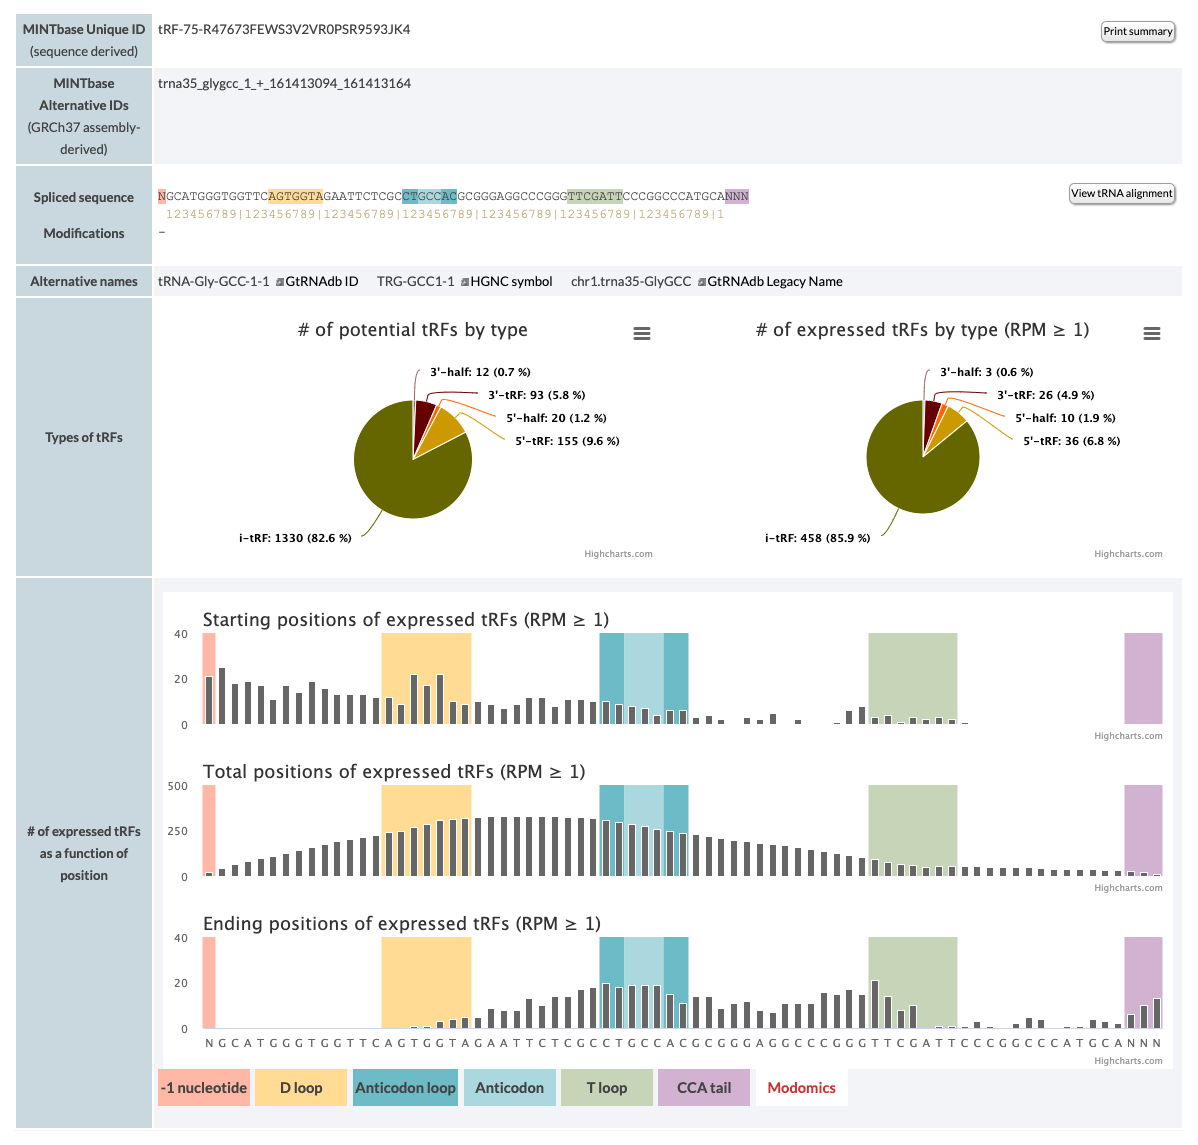
The results consist of the entities described below.
- MINTbase Unique ID (sequence derived):The unique tRNA name as defined by the License Plate nomenclature. This ID that depends solely on the molecule's genomic sequence and, hence, transcends assemblies and species. You can click the "Print" button, to print the page or save it to a pdf. Make sure that "print background colors" or a similar button is clicked when you open the print form.
- MINTbase Alternative IDs (GRCh37 assembly-derived): Assembly specific ID that consists of the tRNA ID (see below), the start and end position of the tRF in the mature tRNA and the tRF's length.
- Spliced sequence: tRNA spliced sequence and ruler. The button links to the tRNA aliognment of the tRNA.
- Modifications: tRNA modifications from Modomics
The pie chart shows the numbers of all potential tRFs versus the numbers of the tRFs that are expressed in the samples that the database currently contains. The bar charts pile up the expressed fragments on the tRNA. Each fragment counts once, regardless of the maximum RPM or in how many samples it can be found.
MINTbase versions and implementation
MINTbase was developed in 2016 [1] and had a major update in 2017 [2]. Samples are currently being added to MINTbase without changing the version number. Please note that results might change since the last time you run a search.
v2.0 (2019)
- Several hundred samples were added. The underlying schema and web application remained the same so, we decided not to change the version.
v2.0 (2018)
- TCGA datasets MINTbase v2 contains the tRF profiles of The Cancer Genome Atlas (TCGA) datasets.
- Introduced plots on Summary vista. Two bar plots and two boxplots showing number of datasets and RPM per TCGA cancer.
- Replaced the binary "expressed yes/no" with (RPM) in all vistas and the search form
- Added the tissue search filter and underlying database structure. You can view the list of all tissue keywords used by MINTbase here.
- Added more links between vistas
- Added a few more columns across vistas. They include "MINTbase unique ID", "length", and "number of datasets".
- Changed the position of vistas in the search form
v1.0 (2016)
Initial version is released. MINTbase is written in MySQL, Java and JavaScript. Samples are analyzed using MINTmap. Charts are created using Highcharts.
References
- Pliatsika, V, Loher, P, Magee, R, Telonis, AG, Londin, E, Shigematsu, M, Kirino, Y, Rigoutsos, I. MINTbase v2.0: a comprehensive database for tRNA-derived fragments that includes nuclear and mitochondrial fragments from all The Cancer Genome Atlas projects. Nucleic Acids Res. 2018;46 (D1):D152-D159. doi: 10.1093/nar/gkx1075. PubMed PMID:29186503 PubMed Central PMC5753276.
- Pliatsika, V, Loher, P, Telonis, AG, Rigoutsos, I. MINTbase: a framework for the interactive exploration of mitochondrial and nuclear tRNA fragments. Bioinformatics. 2016;32 (16):2481-9. doi: 10.1093/bioinformatics/btw194. PubMed PMID:27153631 PubMed Central PMC4978933.
- Thompson DM, Lu C, Green PJ, Parker R. tRNA cleavage is a conserved response to oxidative stress in eukaryotes. RNA. 2008 Oct;14(10):2095-103. doi: 10.1261/rna.1232808. Epub 2008 Aug 21. PubMed PMID:18719243 PubMed Central PMC2553748.
- Fu H, Feng J, Liu Q, Sun F, Tie Y, Zhu J, Xing R, Sun Z, Zheng X. Stress induces tRNA cleavage by angiogenin in mammalian cells. FEBS Lett. 2009 Jan 22;583(2):437-42. doi: 10.1016/j.febslet.2008.12.043. Epub 2008 Dec 27. PubMed PMID:19114040.
- Kumar P, Kuscu C, Dutta A. Biogenesis and Function of Transfer RNA-Related Fragments (tRFs). Trends Biochem Sci. 2016 Aug;41(8):679-689. doi: 10.1016/j.tibs.2016.05.004. Epub 2016 Jun 1. PubMed PMID:27263052 PubMed Central PMC5173347.
- Telonis AG, Loher P, Honda S, Jing Y, Palazzo J, Kirino Y, Rigoutsos, I. Dissecting tRNA-derived fragment complexities using personalized transcriptomes reveals novel fragment classes and unexpected dependencies. Oncotarget. 2015;6 (28):24797-822. doi: 10.18632/oncotarget.4695. PubMed PMID:26325506 PubMed Central PMC4694795.
- Telonis AG, Loher P, Kirino Y, Rigoutsos I. Nuclear and mitochondrial tRNA-lookalikes in the human genome. Front Genet. 2014 Oct 8;5:344. doi: 10.3389/fgene.2014.00344. PubMed PMID:25339973 PubMed Central PMC4189335.